Soilynx Blog
Agronomy + Data
Practical guides on precision ag, variable-rate application, and soil data from the Soilynx team.
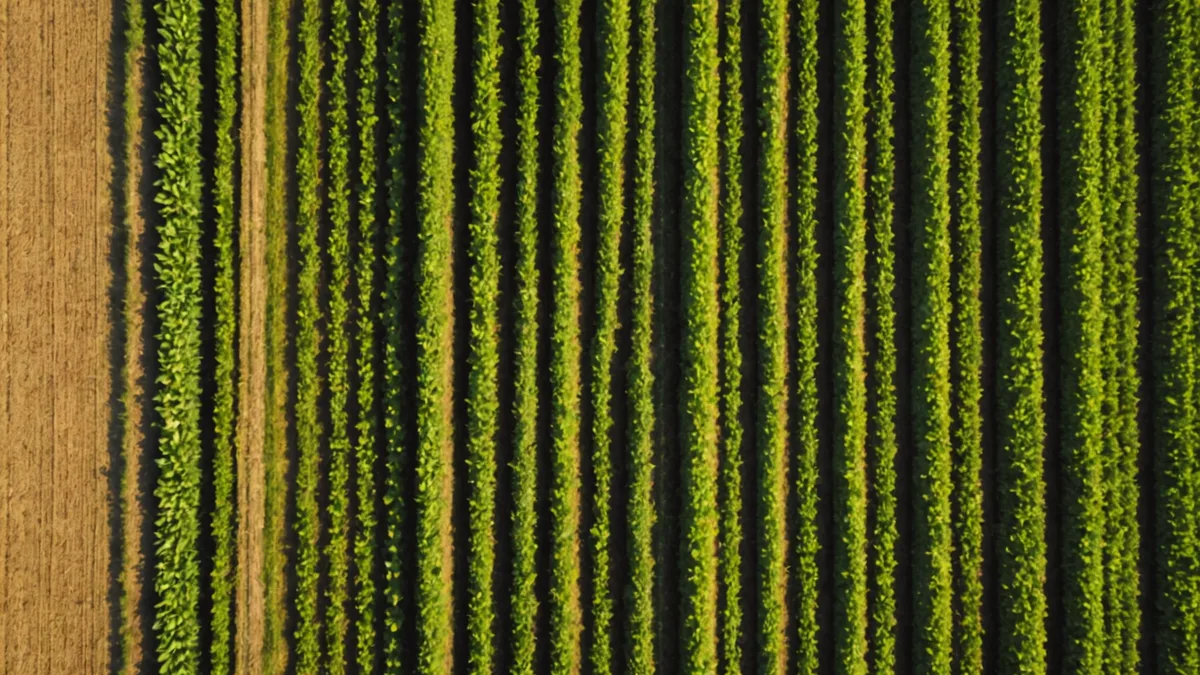
Variable-Rate Nitrogen vs. Uniform Rate: What the Numbers Actually Show
We looked at input cost data from 14 Iowa corn farms that switched from uniform to variable-rate nitrogen application. The average input reduction was 19%.
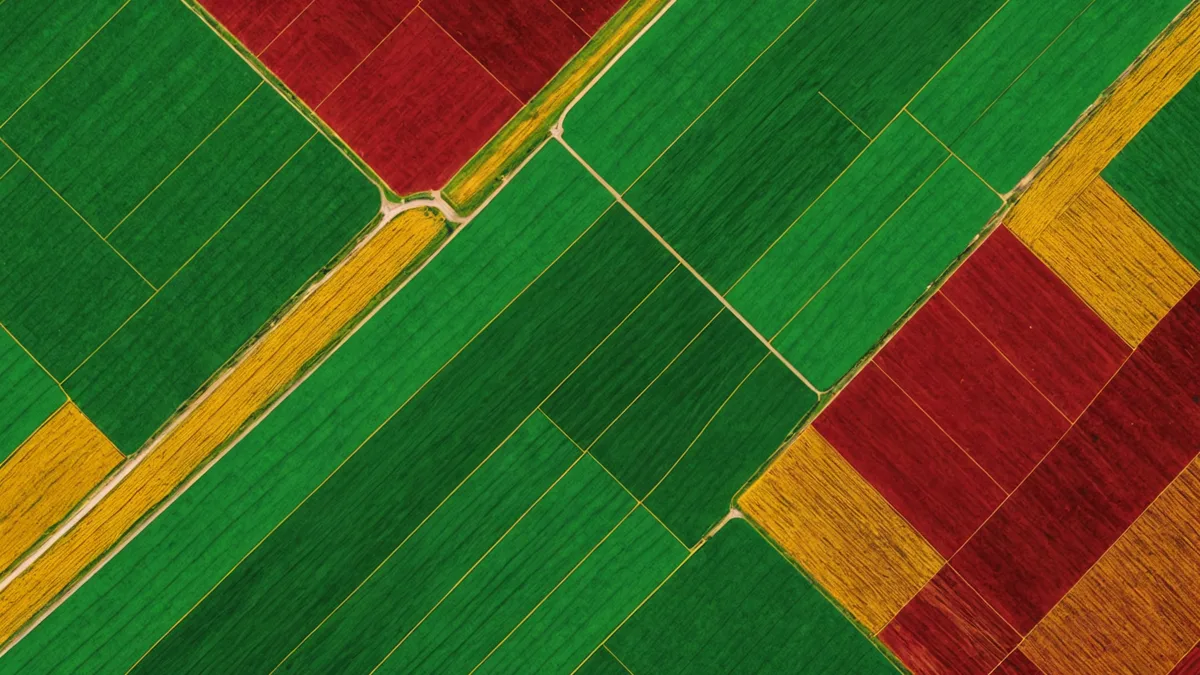
Reading NDVI Maps During Corn Vegetative Stages: What the Colors Mean
A dark-red patch on your NDVI map doesn’t always mean nitrogen deficiency. Walk through how to distinguish stress types from multispectral bands.
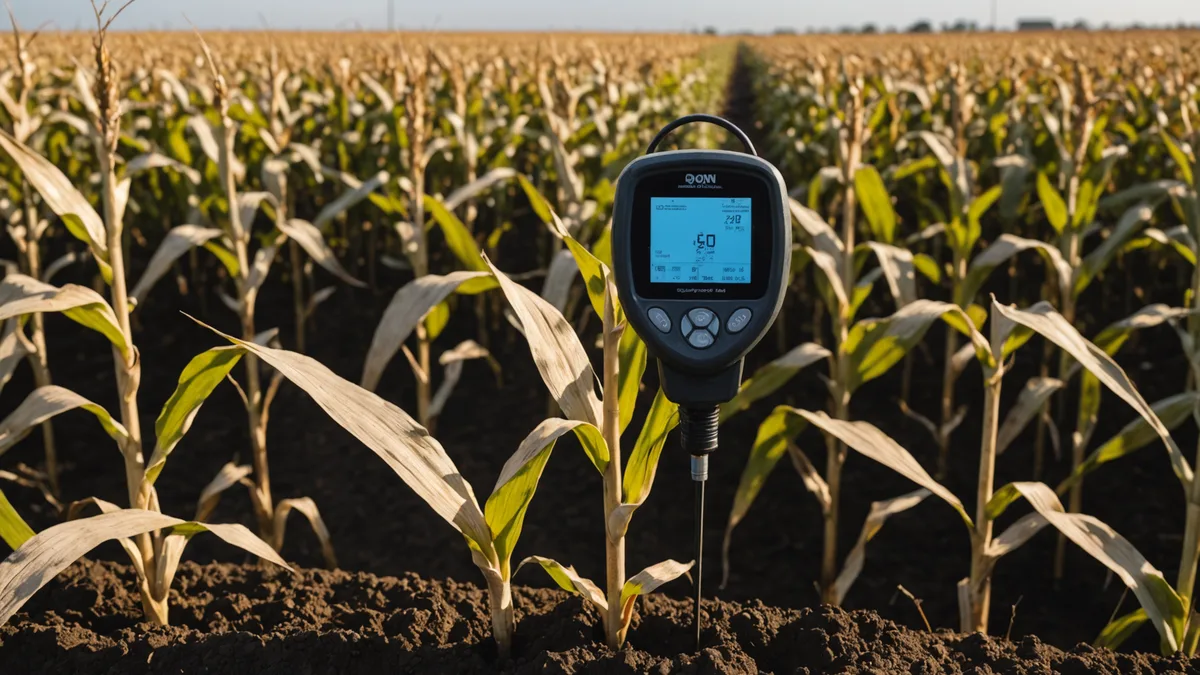
Where to Place Soil Moisture Sensors in a Variable-Soil Field
Sensor placement is the difference between representative data and expensive noise. Our guide to choosing sensor locations in fields with high texture variability.
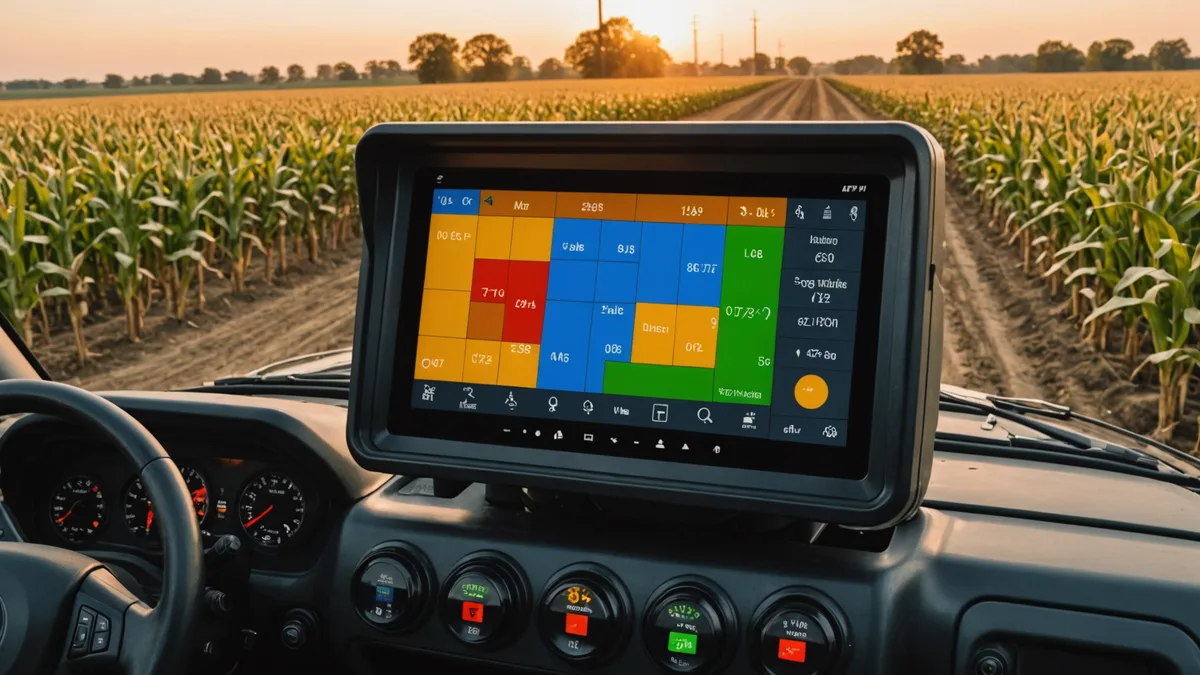
Prescription File Formats Explained: ISOXML, John Deere Operations Center, and Trimble
If you’ve ever tried to load a prescription file and gotten a format error, this is the guide you needed.
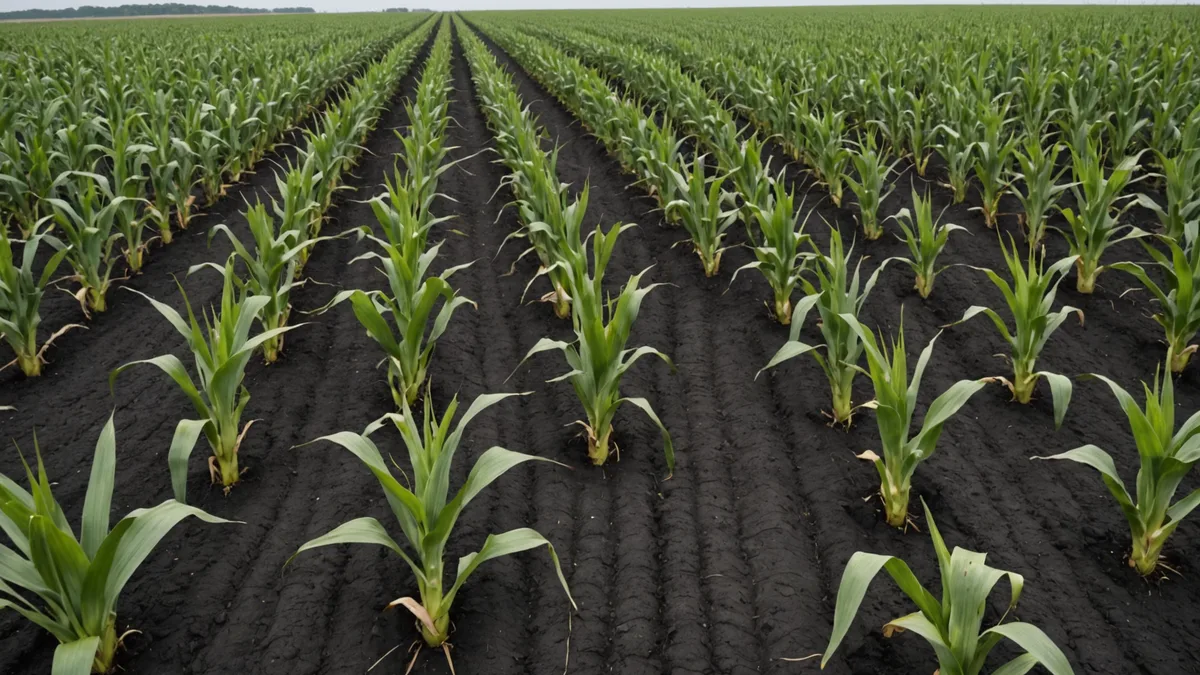
Managing Dryland Corn Water Use Efficiency with Soil Moisture Data
Iowa dryland corn faces increasing pressure from irregular rainfall patterns. Here’s how in-field soil moisture monitoring changes irrigation and replanting decisions.
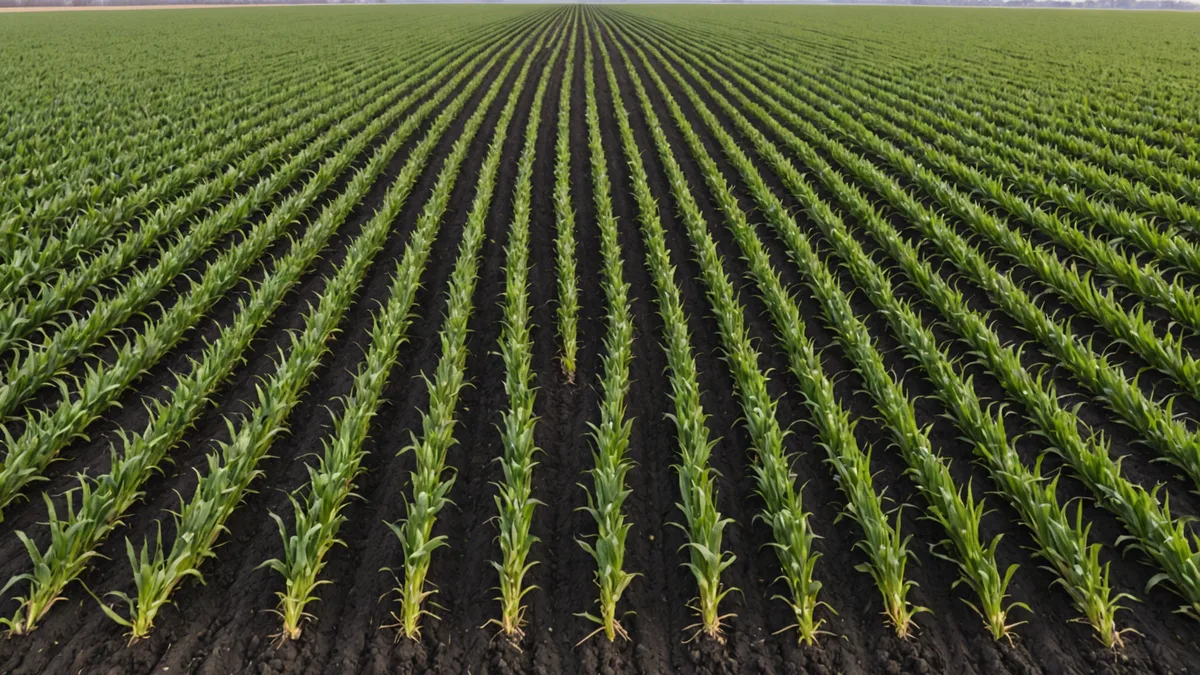
How Cover Crops Show Up in Your NDVI Data — and What to Do About It
Cover crop biomass shows up as high NDVI signal in late winter / early spring satellite passes. If you’re not accounting for this, your spring prescription zones may be wrong.
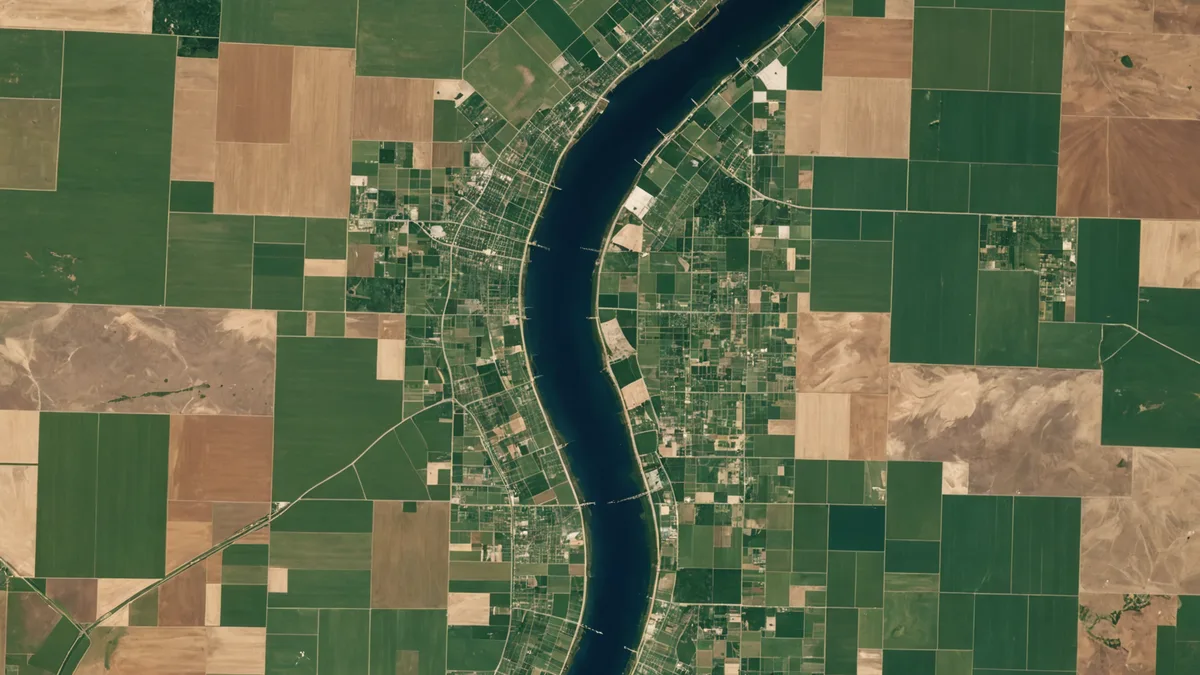
Satellite Revisit Frequency: How Often Is Your Field Actually Being Imaged?
Sentinel-2 has a 5-day revisit time — but cloud cover means your actual clear-image frequency is more like every 10–25 days in the Midwest.
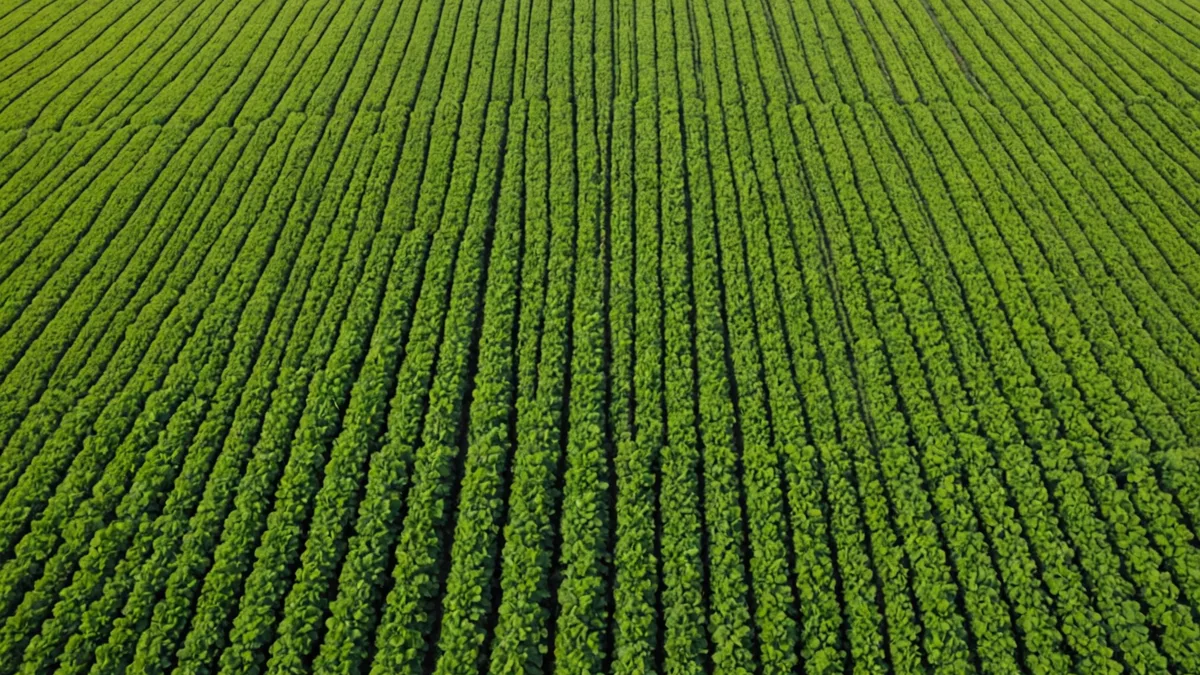
Variable-Rate Seeding for Soybeans: Building Yield Zones from Soil Data
Variable-rate seeding for corn gets most of the attention, but soybean VRS has a strong ROI case in fields with high soil variability.
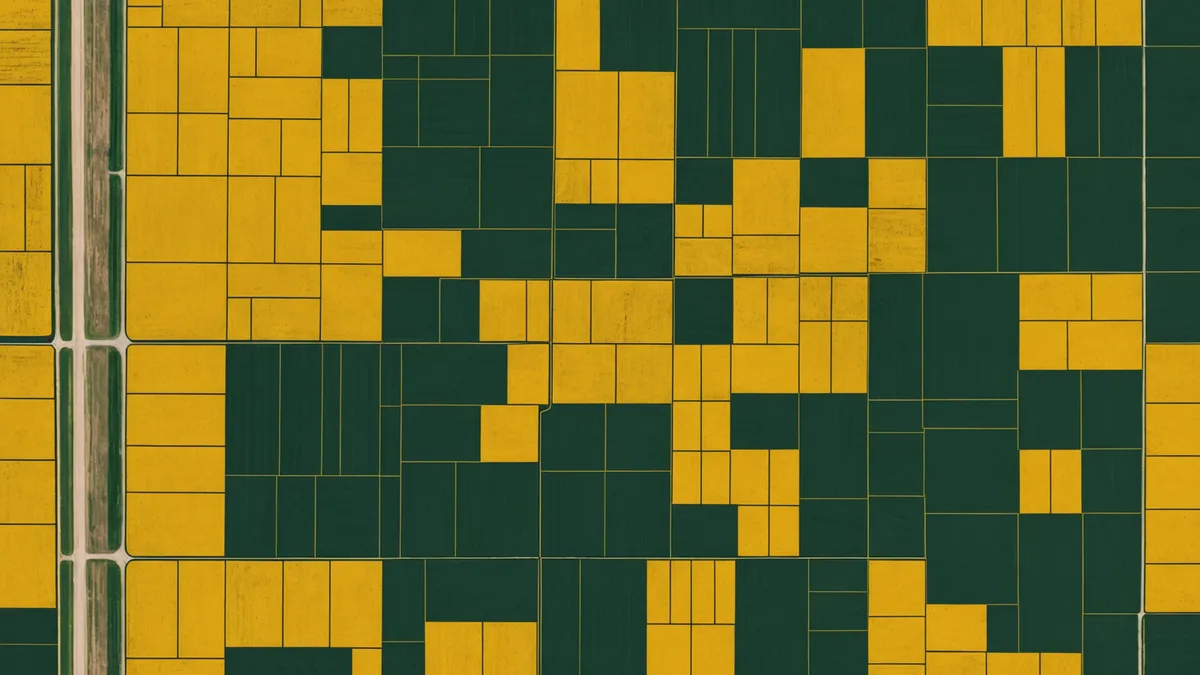
Getting Your Field Boundaries Right Before the Season Starts
Inaccurate or overlapping field boundaries cause more prescription problems than any other setup issue. A guide to digitizing boundaries correctly.

Who Owns Your Field Data? What Growers Should Demand From Ag Software Contracts
When a precision ag platform is owned by an agrochemical company, your field data may be informing their pricing and product decisions.
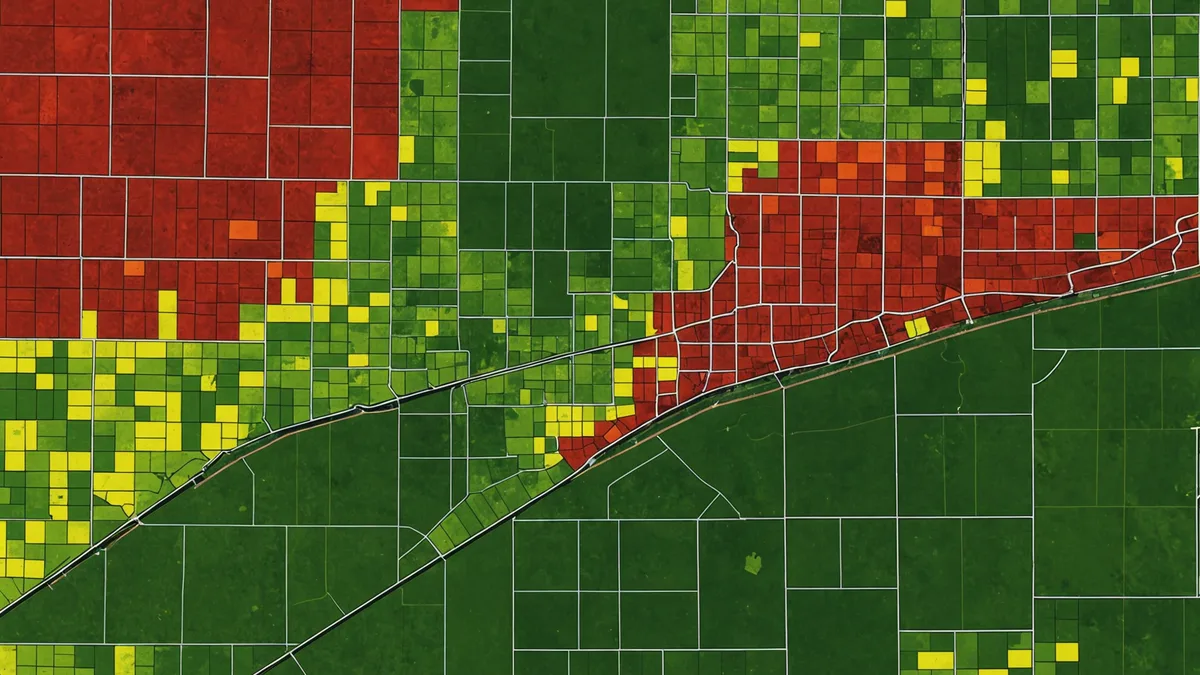
Using Yield Maps and Soil Samples Together to Draw Better Management Zones
Neither yield maps nor soil tests alone give you the full picture. The combination produces management zones that hold up across multiple seasons.
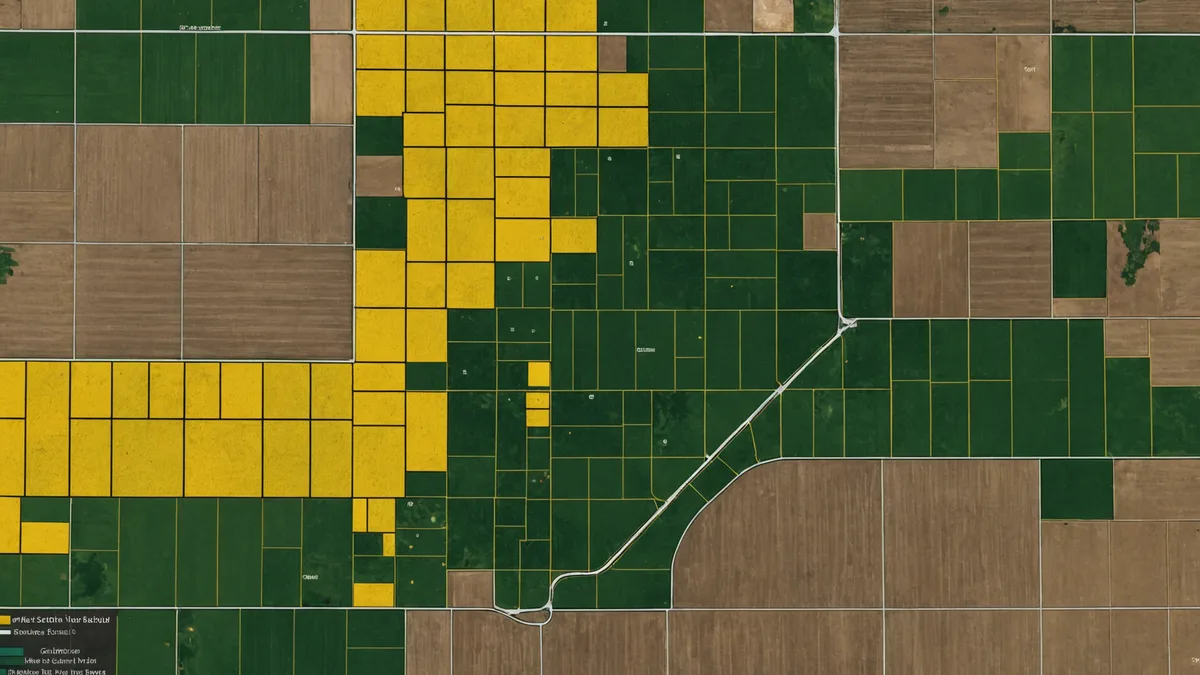
Zone Sampling for P and K: How to Cut Soil Test Costs Without Losing Precision
Grid sampling at 2.5-acre grids is expensive. Zone sampling using management zones from satellite + soil EC data can reduce your sample count by 50%.
Building Your 2026 Input Budget from Last Season’s Field Data
Winter is the right time to use yield maps and soil test results to find where you can cut fertilizer pounds without cutting yield — before pre-pay deadlines arrive.
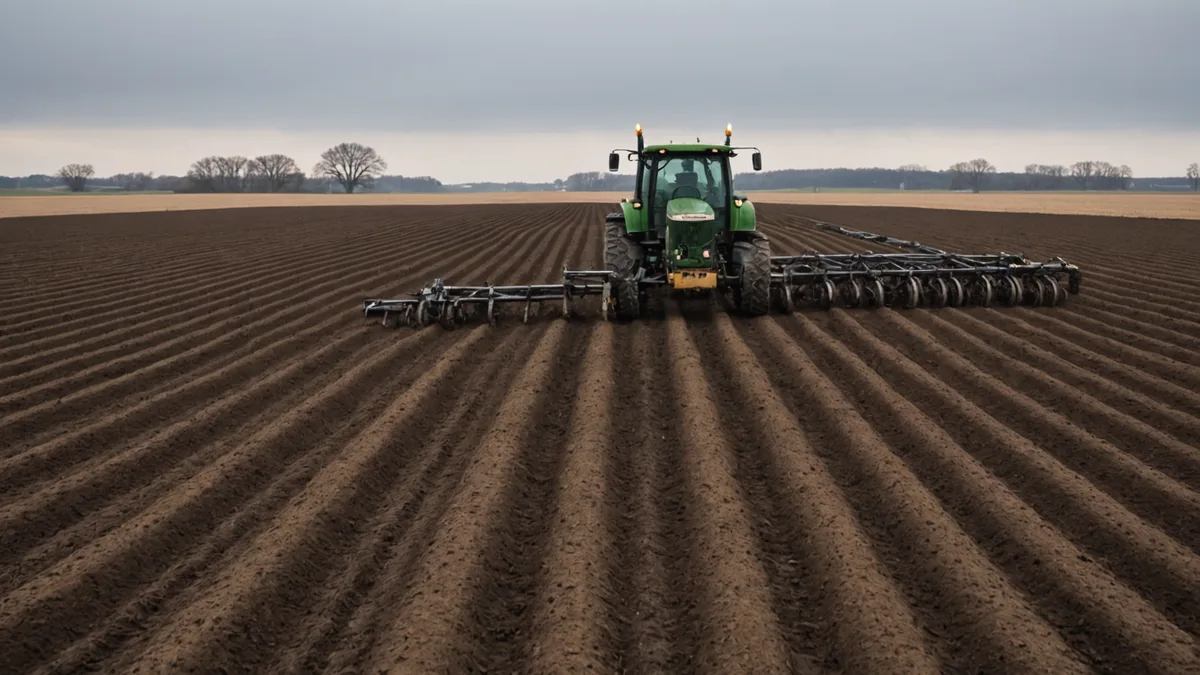
Pre-Season Prescription Review: What to Verify Before the Planter Leaves the Shed
Zone boundary drift, ISOXML format mismatches, unit-of-measure errors — a practical checklist for catching prescription problems before they happen in the field.
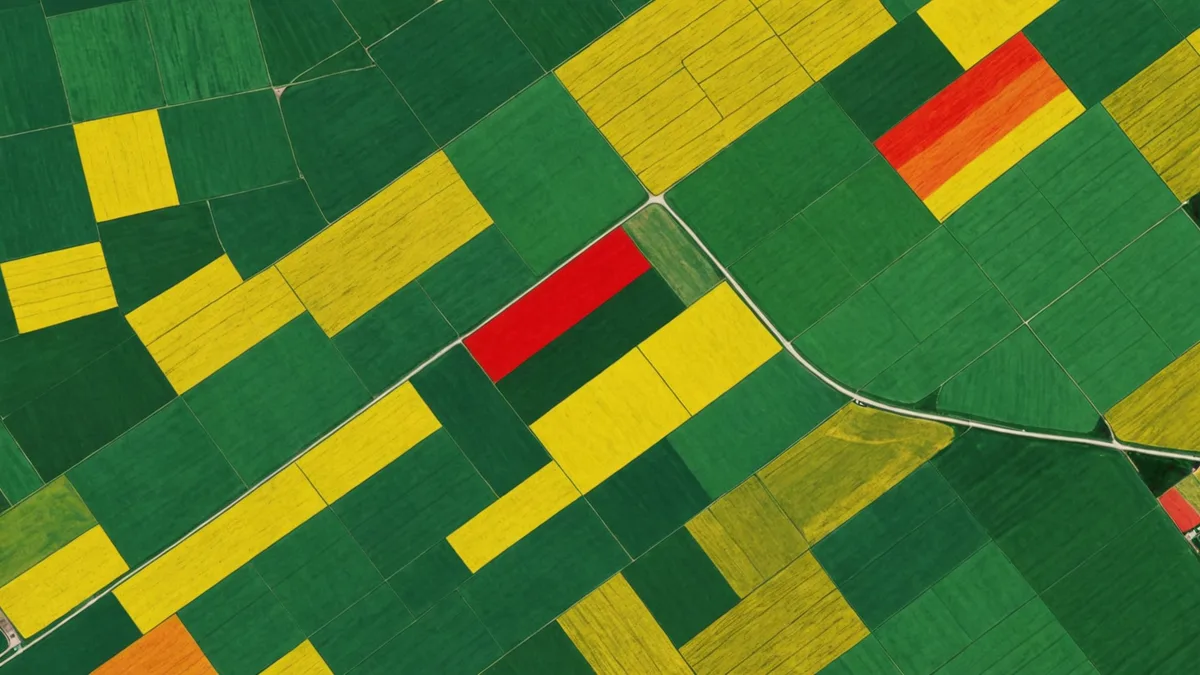
Early-Season NDVI: Why the First Satellite Passes of the Year Are Worth Saving
The earliest clear-sky image after emergence sets your monitoring baseline for the whole season. Here’s how to use pre-canopy imagery to spot soil variability and emergence issues early.
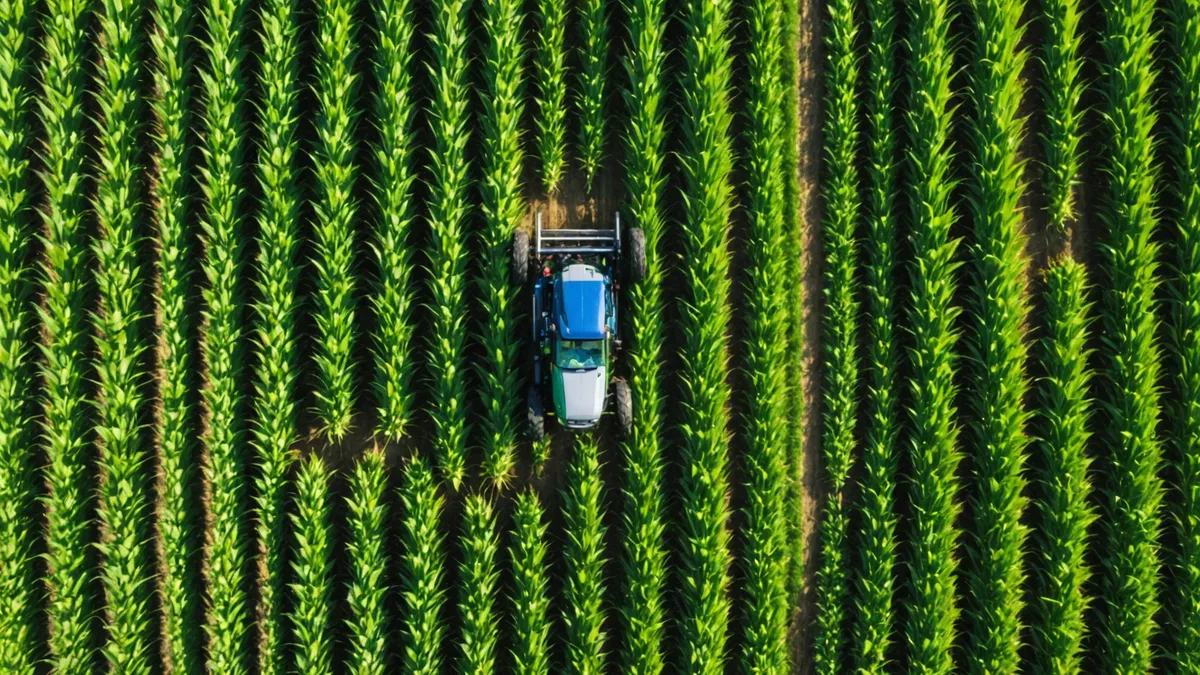
Timing Your Sidedress Pass: Using Satellite Imagery and Soil Moisture to Build a Variable-Rate N Prescription
At V6–V10 corn, the crop is already showing you where nitrogen is limiting. How to read early-vegetative NDVI alongside soil moisture to build a sidedress prescription before the window closes.