Every precision agriculture platform that shows you satellite imagery will tell you the same thing in the marketing copy: Sentinel-2 revisit time is 5 days. That's true. It's also only a small part of the story that matters for actually managing crops in the Midwest.
When we built the satellite data pipeline for Soilynx, one of the first things Cole worked through was the gap between nominal revisit frequency and usable imagery frequency. They're not the same number, and pretending they are leads to bad expectations about what satellite-derived NDVI can and cannot tell you during the growing season.
This post is an honest breakdown of how Sentinel-2 orbital mechanics, cloud cover, and image quality constraints interact — and what that means for your scouting and prescription workflows.
What "5-day revisit" actually means
Sentinel-2 is a constellation of two satellites: Sentinel-2A and Sentinel-2B, operated by the European Space Agency. Each satellite completes a full orbital cycle every 10 days. Because they're offset in orbit by 180 degrees, the combined constellation achieves a 5-day revisit cycle at mid-latitudes.
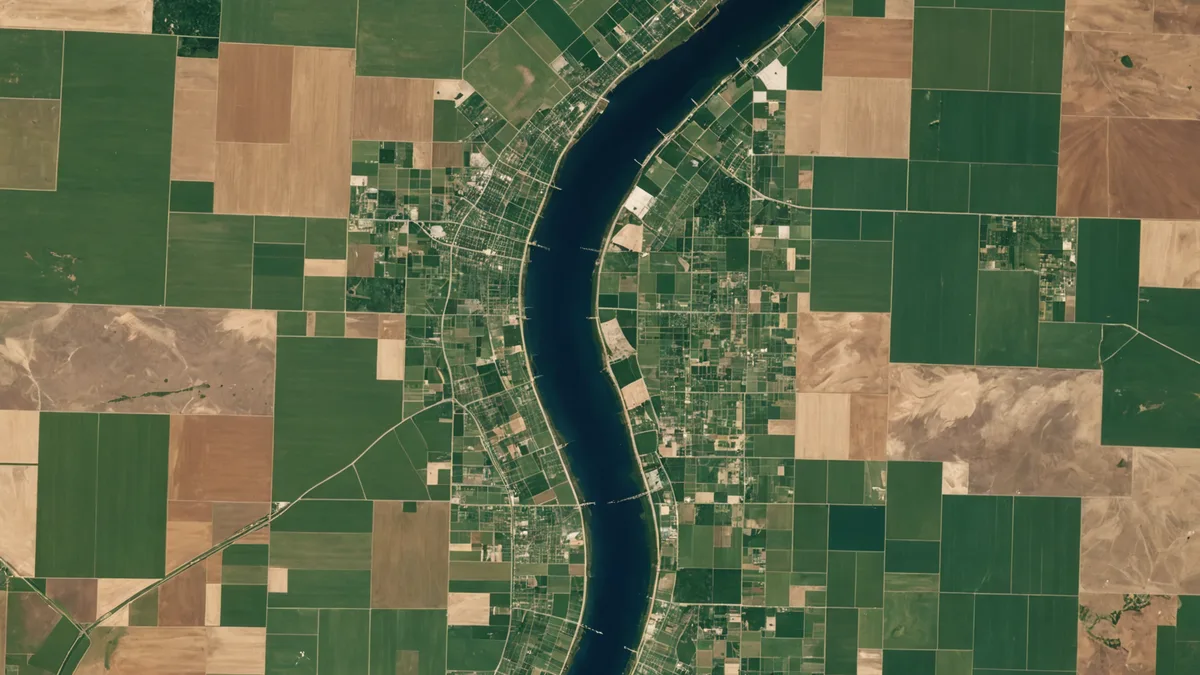
Iowa sits between roughly 40° and 44° N latitude. At that latitude, the Sentinel-2 swath width of 290 km gives reasonable overlap between adjacent orbits, which slightly improves effective coverage frequency compared to the equator. In theory, you're looking at a new image opportunity every 5 days.
In practice, the satellite collects data during every pass whether conditions are good or not. That raw acquisition gets catalogued by ESA's Copernicus Open Access Hub. What matters for agriculture is not how often the satellite flies over — it's how often the resulting image is actually usable.
Cloud cover: the dominant constraint in the Midwest
This is where the 5-day number erodes quickly. Iowa's cloud cover climatology is not favorable for optical remote sensing during key crop growth periods.
In a typical May-June window — which is when corn and soybean fields are establishing and early-season variability is most actionable — cloud cover in central Iowa averages somewhere between 55% and 65% of days. Some years run wetter. June 2024 was a near-total washout for usable Sentinel-2 imagery across much of the Corn Belt, with only 2-3 clear acquisitions across the entire month for many fields.
Even when a scene looks "clear" in the Copernicus catalog metadata, you need to examine the cloud mask at the pixel level. Thin cirrus clouds and haze can reduce reflectance values enough to corrupt NDVI calculations without triggering the scene-level cloud flag. Sentinel-2's SCL (Scene Classification Layer) band helps, but it's imperfect — particularly over bare soil in early spring and over transitional crop canopies at V3-V5 corn.
The practical result: during the core growing season in the Midwest, expect 8-15 usable cloud-free or near-cloud-free acquisitions between May 1 and September 30. That works out to a clear image every 8-15 days on average, with significant variance depending on the year and the specific sub-region of your field's watershed.
Resolution limits and what you can detect
Sentinel-2 multispectral bands relevant to vegetation (Band 4 at red, Band 8 at NIR, Band 8A at red-edge, Band 11 at SWIR) are available at 10-20 m spatial resolution. For most Midwest row-crop fields of 80+ acres, that's sufficient to distinguish management zone-level variability — patches of low biomass, uneven emergence, or stress zones larger than roughly 1,500 square feet are detectable.
We're not saying Sentinel-2 replaces in-field scouting for detecting early disease pressure or individual plant emergence failures. A 10-meter pixel covers about 100 square feet of ground. A 2-acre low-emergence patch? Sentinel-2 will show it. Three plants with sudden death syndrome in the middle of a healthy zone? You'll need boots on the ground.
The appropriate role for Sentinel-2 NDVI is prioritizing where to scout. When a cloud-free image comes in showing a persistent red zone in the southeast corner of a field that's been low for two consecutive acquisitions, that's meaningful signal. Go look at that corner. The satellite isn't replacing your agronomist — it's telling them where to spend time.
How we handle temporal gaps in Soilynx
Because clear imagery is intermittent, we built the Soilynx data pipeline to work with what's available rather than simulate continuity that doesn't exist. A few practical choices this led to:
We apply per-scene cloud masking using the Sentinel-2 SCL band at the pixel level before any NDVI computation. A cloudy pixel gets masked as invalid rather than producing a misleading value. This means some images may have valid data for only 40-60% of a field's pixels — and we surface that coverage percentage to users rather than hiding it.
For the NDVI time series we display in the platform, we composite multiple acquisitions over a rolling window when cloud-free coverage within a single scene is insufficient. This introduces some temporal smearing, but it's more honest than showing a confidence value that implies current conditions based on old data.
We also tag each NDVI layer with its actual acquisition date and cloud-free coverage percentage. If the most recent usable image for a field is 18 days old, we say that. Some platforms display satellite-derived NDVI without surfacing the acquisition date, which can create false confidence that you're seeing something current when you're looking at nearly three-week-old data.
Planet and commercial imagery: worth it for scouting?
Planet's Dove constellation offers daily revisit and 3-5 m resolution, which eliminates the temporal gap problem. The tradeoff is cost and the narrower spectral range of the basic PlanetScope product — fewer bands means less flexibility for computing the red-edge indices that are particularly useful for detecting early nitrogen and water stress before it's visible in the red/NIR NDVI ratio.
For fields with extremely high variability — say, a 180-acre field with a significant wet-corner drainage problem that affects soybean yield in about 20% of the field every wet year — the argument for daily Planet imagery during the first 60 days of the season is real. You'd actually catch the ponding event and the subsequent root disease establishment in the affected zone while there's still time to adjust management.
For most row crop situations, the Sentinel-2 cadence is adequate if you understand its limitations. The key is not expecting the satellite to substitute for timely scouting during critical windows. It's best used as a persistent monitoring layer that reveals structural variability and flags anomalies worth investigating.
Setting realistic expectations with your data
A few guidelines for working with Sentinel-2 imagery in the Corn Belt:
Build your management zones before the season using composite imagery from the prior fall or from early spring bare-soil reflectance. That's when cloud-free imagery is most reliably available and when soil features are most visible. Don't rely on a single in-season acquisition to draw zone boundaries on the fly.
During the growing season, think of Sentinel-2 as an anomaly detection tool, not a real-time monitoring feed. Check for meaningful changes between acquisitions rather than looking at any single image in isolation. A persistent low-NDVI zone that shows up across three separate clear acquisitions during vegetative growth is actionable. A single image showing what might be stress could be residual cloud contamination.
Note the acquisition date on everything you act on. This sounds obvious, but in practice we see growers making scouting decisions based on imagery they've implicitly assumed is recent when it's actually 2-3 weeks old. The Sentinel-2 metadata gives you the exact UTC timestamp of acquisition — use it.
Understand that spatial coverage within a single scene varies. Two fields 20 miles apart might have very different cloud-free data availability from the same acquisition, depending on how cloud systems moved across the path during the satellite overpass. Check coverage per field, not just per scene.
The satellite is a useful tool. It's not a crystal ball. Knowing its temporal and spatial constraints helps you decide when to trust it and when to get out of the truck and walk the field.