The Soilynx Platform
One platform. Soil sensors, satellite, prescriptions.
Three data inputs — satellite imagery, in-field sensor probes, and your existing soil test points — fused weekly into variable-rate prescription files your display terminal can read.
Data Layer One
Satellite overhead, sensors underground
Two independent measurement streams updated weekly: multispectral reflectance from Sentinel-2 at 10-meter resolution above the canopy, and volumetric water content plus bulk EC from in-field probes below the root zone. Neither source alone gives you a complete management zone picture. The fusion does.
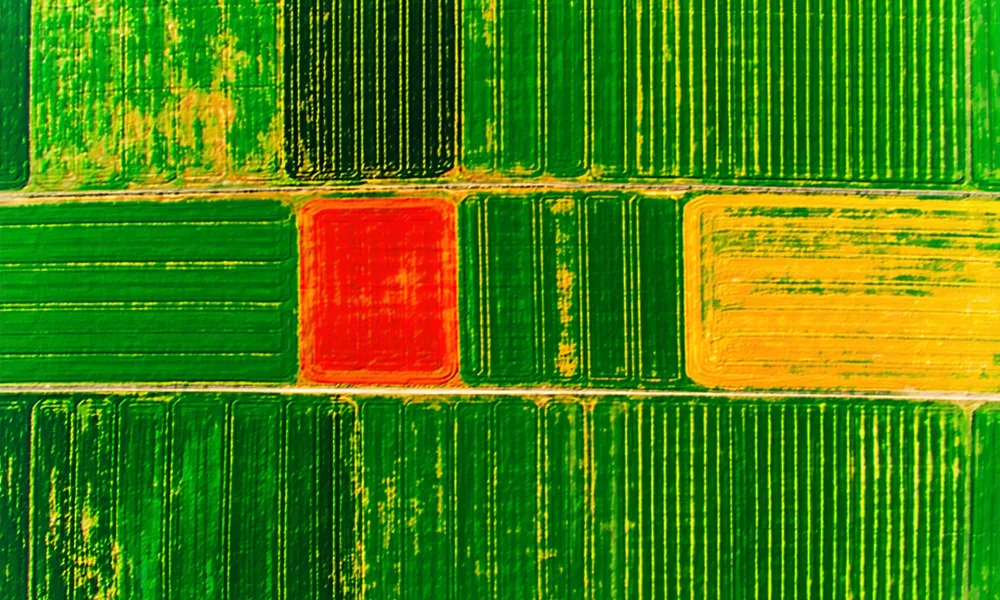
Multispectral Satellite Data
Sentinel-2 at 5-day revisit, Landsat 8/9 at 16-day. Band combinations computed on ingest: NDVI, GNDVI, red-edge chlorophyll index, NDWI. Cloud masking applied automatically — no cloud-obscured composite averaging.
In-Field Soil Sensor Network
Campbell Scientific, Decagon/Meter Group, and Stevens sensor hardware supported. Volumetric soil moisture at 3 depths (15 cm, 30 cm, 60 cm), soil temperature, and bulk electrical conductivity uploaded at 15-minute intervals.
How Zones Are Drawn
The zone model doesn’t guess. It correlates.
Management zone boundaries are drawn from four co-registered data layers — not from a single NDVI snapshot, not from a static historical map. Soilynx is not a satellite viewer or a data dashboard. The zone map is an intermediate step. The prescription file is the output.
NDVI Temporal Variance
Zones where NDVI swings more than 0.15 units across seasons signal an underlying soil constraint — low organic matter, drainage restriction, or clay subsoil — not just in-season weather. Consistently high-variance zones get finer management zone boundaries.
Soil EC Layering
Apparent soil electrical conductivity from in-field probes and historical EC survey points is co-registered against satellite bands. High EC correlates with elevated clay content and water-holding capacity; low EC with coarser texture and lower CEC. These relationships anchor the rate differences between management zones.
Yield Stability Maps
Multi-year combine yield monitor data (2-10 seasons) is imported on setup. Yield stability zones — consistently high, consistently low, inconsistently variable — anchor the zone generation model.
Prescription Output
Files, not reports
Soilynx outputs are prescription task files your equipment reads directly — not PDF reports you have to translate into a rate table by hand. Every prescription run exports all four supported formats simultaneously.
<TSK A="TSK1"
     B="Field_N_VRx_2026-06-15"
     G="PFD1">
  <TZN A="1">
    <!-- Zone 1: High-yield, low stress -->
    <PLN A="1">
      <LSG A="1">
        <PNT C="41.6234"
              D="-91.5382"/>
      </LSG>
    </PLN>
    <PDV A="DDI-1"
          B="100"/>
    <!-- 100 lbs N/ac -->
  </TZN>
  <TZN A="2">
    <!-- Zone 2: Moderate stress, clay subsoil -->
    <PDV A="DDI-1"
          B="140"/>
    <!-- 140 lbs N/ac -->
  </TZN>
</TSK>
Your Data
Your field data belongs to you.
Not to Bayer. Not to Corteva. Not to any agrochemical input company. Soilynx is an independent, bootstrapped company in Iowa City with no financial relationship with seed or chemical suppliers.
- No field data is sold to, shared with, or processed for any input supplier
- Iowa-based data storage — not routed through third-party agrochemical platforms
- TLS 1.3 encrypted transmission; AES-256 at rest
- Full data export at any time — all soil test points, yield maps, and prescription history in standard GIS formats
- Account cancellation removes all stored field data within 30 days per written request
See the platform in your fields
First field free for 30 days. No credit card. Works with your existing soil data and display terminal.