Two years of monitoring data across enrolled Iowa farms is enough to say something meaningful — not about what regenerative agriculture might do in ideal conditions, but about what it actually does in the varied, complicated, sometimes drought-stressed reality of central Iowa corn belt farming. This article presents aggregate patterns from the first monitoring period across our initial farm cohort, along with the factors we've observed driving variation in outcomes. We're reporting ranges and patterns, not guarantees, because that's what the data actually shows.
The Farm Cohort and What It Looks Like
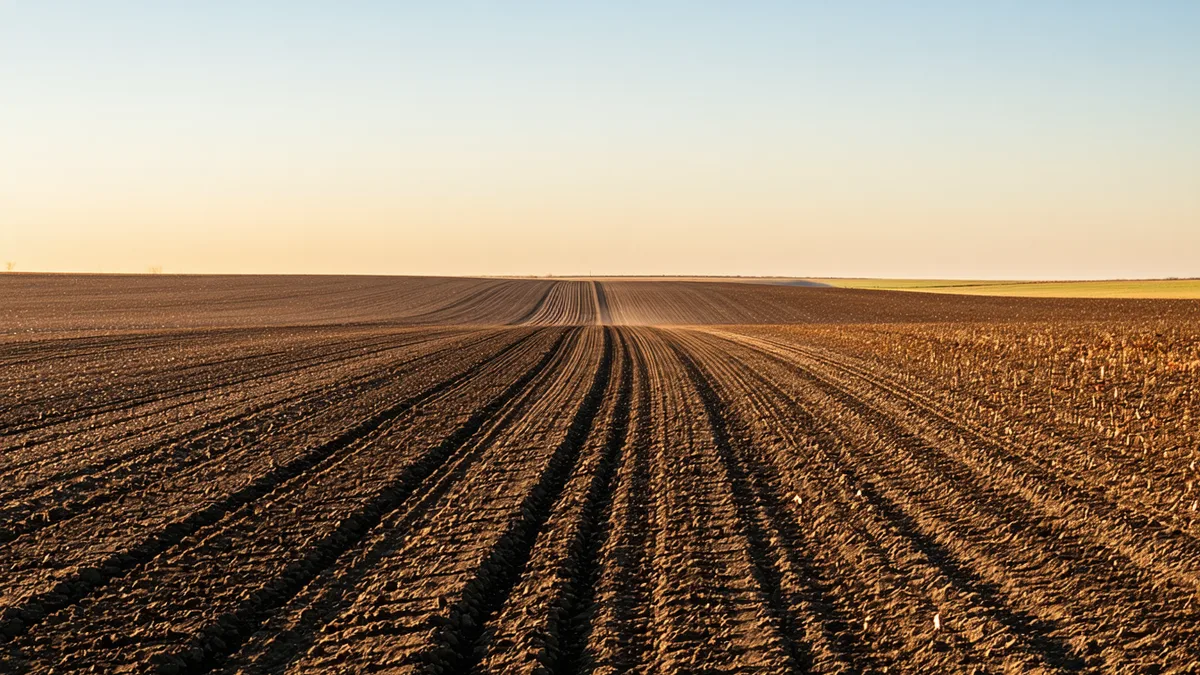
The farms in this analysis represent enrolled acres primarily across Story, Hamilton, Boone, and Jasper Counties in central Iowa — prime Cornbelt ground with a mix of Clarion-Nicollet-Webster soil associations that dominate the Des Moines Lobe landscape. Farm sizes range from under 500 acres to over 3,000 acres. The cohort skews toward corn-soybean rotation with some corn-corn ground, and includes both farms that had been practicing no-till for several years before enrollment and farms that initiated no-till and cover cropping at or near project enrollment.
The management practices represented across the cohort include: continuous no-till (the most common primary practice), cover cropping with winter rye or cereal rye-hairy vetch mixes as the dominant species, reduced synthetic nitrogen application with legume cover crop N-credit, and in a smaller subset, addition of compost or manure inputs. No farms in this analysis have converted to perennial cover — all remain in annual grain production. This is an important scope clarification: the results described here are specific to conservation practice changes within annual row crop systems, not conversion to grassland or silvopasture.
SOC Change at Two Years: The Aggregate Pattern
Across the cohort, two-year SOC changes in the 0–30 cm depth interval — the most responsive horizon for topsoil management changes — ranged from negligible (within measurement uncertainty) to approximately 0.7 percentage points of absolute SOC concentration. The majority of fields showed measurable increases in the 0.2–0.5 percentage point range when practices were implemented as planned and the weather cooperated.
Translating those concentration changes to carbon stock changes (tonnes CO₂e per hectare) requires multiplying by bulk density and depth, so the actual sequestration quantity varies with soil physical properties. On Webster soils with their characteristically high clay content and initially high bulk density, a 0.3% SOC increase translates to a larger tCO₂e/hectare figure than the same concentration change on a lighter-textured Clarion soil at lower bulk density. This is why aggregate results — expressed as an average sequestration rate across the cohort — can be misleading without acknowledging the underlying soil physical context.
We observed minimal detectable SOC change in the 30–60 cm depth interval over this two-year period. This is consistent with the scientific understanding of no-till and cover crop effects — subsoil carbon accumulation under annual management changes is a longer-term process, typically requiring 5–10+ years before statistically detectable increases are measurable at the 30–60 cm depth, even where it is genuinely occurring. Our monitoring protocols include this depth interval because the cumulative long-term picture matters, but buyers and growers should not expect to see meaningful subsoil change credits in initial verification periods.
The Drought Year Effect
The 2023 growing season in central Iowa experienced below-average precipitation in June and July — roughly the period from V6 corn through early reproductive stages. The drought reduced crop biomass inputs into the soil during the cropping season. Cover crop biomass was also reduced in spring 2023 where termination was delayed and growing conditions were dry. On fields where the cover crop was primarily contributing to SOC through above-ground biomass incorporation, the 2023 drought year measurably slowed SOC accumulation relative to model-based expectations.
This matters for MRV: a one-year deviation from expected SOC trajectory is not a failure of the system or a credit invalidation event. Soil carbon responds to net annual organic matter inputs minus decomposition, both of which vary with weather. A rigorous monitoring design captures the actual SOC stock at each measurement event, regardless of whether it matches projections. The verification reports these measured values without adjustment for weather; buyers see the actual, measured change over the monitoring period, including any weather-driven slowdown.
We're not saying weather variability makes soil carbon sequestration unpredictable at the farm level. We're saying the annual variability is real, it shows up in the data, and honest MRV captures it rather than smoothing it out with model-based projections that may miss a drought year's effect on organic matter inputs.
What Drove the Range: High Performers vs. Modest Performers
The farms at the higher end of the SOC gain distribution shared several characteristics. First, longer prior history of no-till before enrollment: farms that had been no-till for 5–7 years before joining the carbon project had reduced the "tillage debt" — the SOC deficit relative to zero-till — and were closer to a new steady state, meaning subsequent cover crop additions showed up more clearly as net accumulation rather than being partially offset by continued recovery from prior tillage. Second, higher cover crop biomass: farms achieving 2,500–4,000 lbs dry matter per acre of cover crop biomass termination were consistently in the higher sequestration range. Third, soils with naturally high clay content (Webster and Nicollet series): the organo-mineral associations in higher-clay soils appear to be stabilizing organic carbon more efficiently than in the sandier, more well-drained Clarion soils at equivalent organic matter inputs.
Farms at the modest end — showing 0.1–0.2% SOC increases or results within measurement uncertainty — were more commonly those that initiated no-till and cover cropping at project enrollment (so the two-year monitoring period captured the early adaptation phase), those on fields with significant tile drain modifications that may alter the soil moisture and temperature regimes governing decomposition, and those that experienced equipment problems leading to incomplete or late cover crop establishment in one of the two growing seasons.
Bulk Density Responses
Several enrolled farms showed a secondary result worth noting: measurable decreases in topsoil bulk density (0–15 cm) over the two-year period, most prominently on fields that had high-compaction histories from conventional tillage. Reductions in bulk density have two implications for carbon accounting: first, they indicate improving soil structure, which is part of the agronomic benefit story; second, they require the carbon stock calculation to account for the volume change, which is handled in the fixed-depth correction approach specified in protocol methodology.
The equivalent-soil-mass correction for bulk density change is an important methodological detail that some projects skip, leading to either over- or underestimation of actual carbon stock changes. When bulk density decreases while SOC concentration increases (both good signs), the carbon stock change on an equivalent-mass basis is typically slightly smaller than the calculation on a fixed-volume basis would suggest. Terrabit's verification model applies this correction where bulk density changes are statistically significant — an operational detail that doesn't change the headline results dramatically, but that matters for protocol compliance and audit defensibility.
Looking at Year Three and Beyond
The SOC accumulation rates observed in the first two years are consistent with the scientific literature for early-phase no-till and cover crop transitions in Mollisol-dominant systems — generally in the range of 0.2–0.8% absolute SOC increase over 2–4 years in the topsoil, decelerating toward a new SOC equilibrium over 10–20 years. The second and third monitoring periods will reveal whether the early momentum is sustained or decelerating, and whether the subsoil horizons are beginning to show accumulation signals.
For farms in the cohort approaching their 5-year mark of regenerative practice, we expect to see more consistent detection of SOC changes in the 30–60 cm depth interval in the upcoming monitoring campaign. Several of these farms have incorporated deep-rooted cover crop species — hairy vetch and turnips have root systems extending below 60 cm in favorable conditions — and the contribution of those root systems to subsoil organic matter is a hypothesis that the monitoring data should eventually allow us to test, if the detection threshold is achievable given sample variance at depth.
The farms that enrolled earliest and have the cleanest management records represent the best available evidence for what the full monitoring trajectory looks like in this geography and soil type. That longitudinal record is one of the most valuable things a soil carbon MRV program builds over time — not just for carbon accounting, but as a scientific contribution to understanding how regenerative practices actually affect carbon cycling in Midwest agricultural soils.
Amara Diallo is the founder and CEO of Terrabit. For enrollment inquiries or to discuss the monitoring results for your operation type, contact [email protected].